 AHMAD AIMAN FAUZI
Posted in Professional Services 6 years ago
i have created several groups, likes departmet A, department B, department c, so in the dashboard admin, for graph/pie chart, by default it only show for how many male and female, how many user online, how can I created pie chart like that in the admin dashboard to know how many are user in department A, b, and C. and if possible show also how many department A are online, and so on.
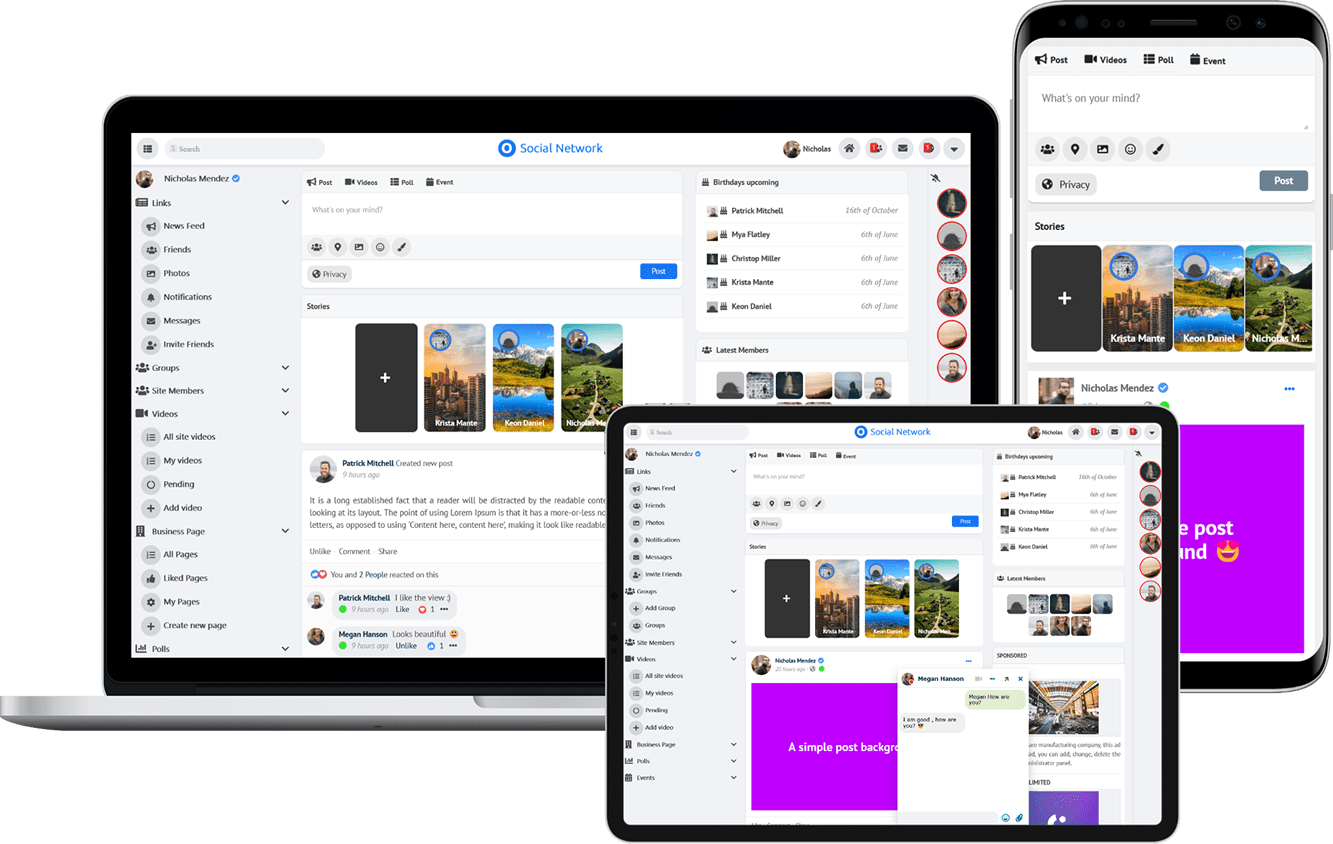
Due to the many requests in the past for additonal features and components we have decided to develope a premium version. Features like Hashtags, Videos, Polls, Events, Stories, Link Preview, etc included in it.
 $199 (Life Time)